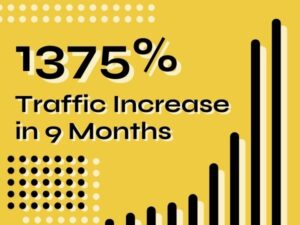
689,135 More Visitors for FinTech SaaS Website
124.45% increase in visitors YoY (from 553,759 to 1,242,849). We worked with this website over 2 years, during which the campaign was active for 6 months every year.
Time to read:
11 min
Posted:
Modified:
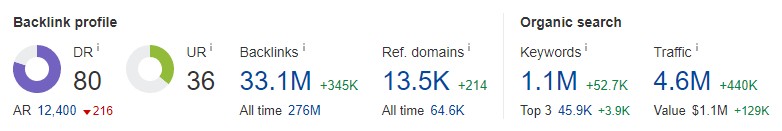
Organic visitors growth from 553,759 to 1,242,894 year over year.
Organic sessions up from 712,205 to 1,562,491 year over year.
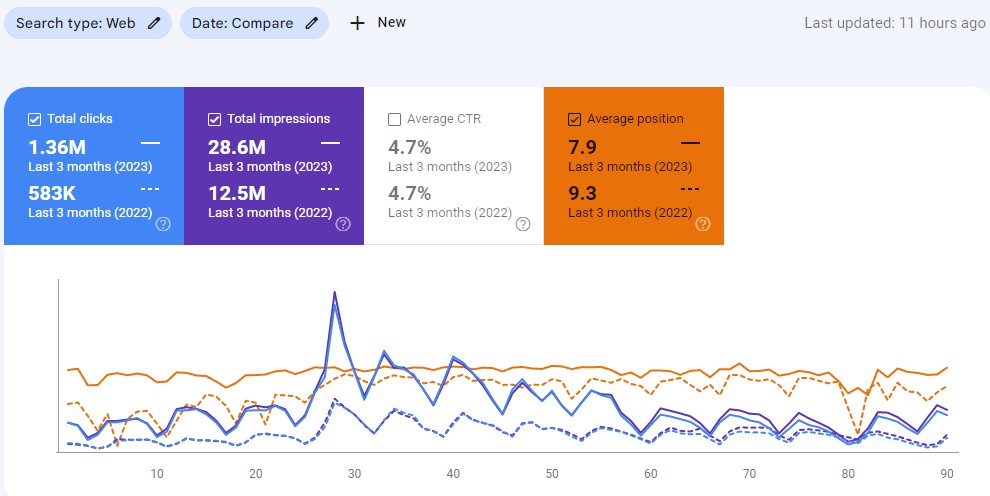
Overall impressions received up from 12.5M to 28.6M year over year..
Growth from 583k to 1.36M clicks in Google Search Console.
Restore the client's website traffic to previous state. What once was a top-ranking website turned into a significant decline, both in and outside the tax season.
Avoid the potential 40% revenue loss (over $1 MILLION). We needed to take any measure available to steer back on course.
Come up with a homework for client for the summer break to maintain the growth cycle – prepare content plan, site template updates, and on-site optimizations.
Bring at least 30% YoY traffic increase for the 2023 tax season. After getting the site back to its former numbers, we had to maintain the growth and provide a decent increase in traffic (and with that, revenue).
Complete set objectives in the client's proposed cycle, Each four months only, with a summer break between them.
Prepare a comprehensive SEO strategy to increase the traffic to the level from year earlier.
Maintain content publishing schedule during the summer break.
Make the best out of the upwind the site received after initial changes.
We started with conducting a deep analysis of the page's performance, focusing on every sources of biggest losses.
Next, we prepared keyword and content plans and devised a link building strategy to recover revenue.
Our link building strategy focused on the quality and not quantity – but we still had to catch up with the competition.
Tax-related websites are very sensitive for outdated and otherwise wrong information, and we were limited on time, so we focused primarily on significant and site-wide oversights.
This case study was developed over two years, during which the campaign was active for six months every year.
Weird, you could say, and I’d definitely agree with you.
This isn’t the usual approach – far from it – but in this case, it’s understandable. Read on to see whether you agree with me.
And, yes, you should be patient and read until the end because this case study has a lot of nuggets.
The Client
The website in question is an already well-established brand in the financial technology (fintech) industry, offering SaaS solutions that help with tax returns.
The customers of the brand are both companies and individuals.
As the niche dictates, the most important part of the year is between January and April each year.
This is when the company makes most of its profits and needs the highest visibility.
Usually, they worked with their previous SEO companies throughout the whole year, making sure they were ready for tax season.
However, this time, something changed…
The Story of a Fall
The tax season of 2019 was superb for the client. They made around $2M during this period and were hoping for a similar result in 2020.
When COVID hit, the client was hoping to do even better because everyone was forced to do their taxes online.
Unfortunately, this wasn’t going to be the case:

Instead of improving, they’d lost almost 17% of sessions, 15% of users, and approximately 20% of the revenue.
It wasn’t pretty.
It’s difficult to know what caused the loss exactly, but their SEO agency back then said it was the competition pushing their marketing efforts very aggressively.
I doubt that, but I can’t track everything back that far.
Anyway, the client believed them and trusted that they would improve.
And hats off to them because they did – the tax season 2021 was almost as good as 2019, both traffic and revenue-wise.

The money was also good, coming close to $2.5M in revenue.
However, something bad happened, and when looking at the forecast, the client wasn’t happy…
Just after the high season, between May and September 2021, the site lost almost 35% of sessions and users.
According to estimates, if this was to impact the high tax season at this rate, the client was looking at a revenue decline of over 40%.
To put it into perspective, at $2.5 MILLION USD minus 40%, we’re talking about a $1 million potential loss.
Even facing a $1,000,000+ revenue loss, the client was still fair towards their old SEO agency and asked them for a strategy.
And again, this is very unusual because the old SEO agency was honest and said they didn’t really have a recovery strategy. They fairly admitted that this was a bit too much for them, and they couldn’t see what the possible cause of the dip was.
Why unusual, you ask?
Well, because agencies are rather holding on to a paying client and try to do everything they can to keep that money rolling in.
So, again, I have nothing but respect for the old agency.
But here’s when the client heard about NoN Agency and reached out to us…
Challenge #1
Knowing we’re down 35% year over year and seeing nothing but red, we had a big challenge in front of us.
Especially because we knew we only had a realistic 4 months (Sept-Dec) to get fully up to speed before the season.
Moreover, the client was totally upfront with us and laid all their cards on the table, telling us that if we manage to recover the revenue, we’ll be … FIRED.
Wait, what?

No, they didn’t say this exactly, or at least it didn’t mean what you thought!
They said that they no longer wish to do SEO for the entire year.
Instead, and only if we deliver, they would like to work with us only from September through March and then pause and restart again in September.
This is why I said in the beginning that the arrangement was a tad unusual.
Can’t blame them, although I wouldn’t say it’s optimal for SEO, but there’s a little more to this deal later.
Let me walk you through what we did.
Action & Implementation
Phase 1: Performance Analysis
We collected all the keywords using Ahrefs and Google Search Console and started hacking through them to see where the biggest losses were.
If you’re ever in this situation, you should go to: GSC → Performance (1) → Compare by date (last six months vs previous) (2) and look at the Queries (3) and Pages (4) that lost most of the traffic.
Here’s the screenshot:

What interests you the most are clicks (column I highlighted in red above).
I, personally, like to combine Query/Keywords data from Ahrefs and GSC into a spreadsheet to see something like this:

As you can see, I pull keywords from both sources and then match them with the respective URLs.
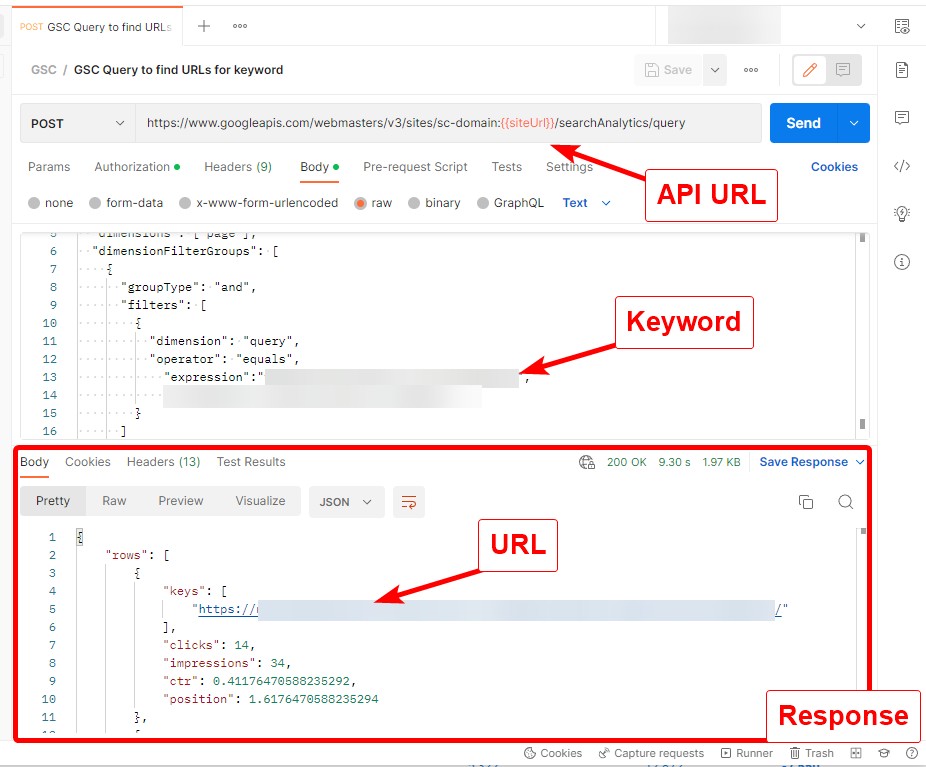
Ahrefs, obviously, gives you the ranking URL right off the bat, but with GSC, I actually do a search through the API.
I built software that does it for me at scale, but you can do it manually in Search Console or through Postman like this:
And then, I added two important tabs in the spreadsheet:
1. Page Losers – this is data directly from GSC.
It looks something like this:

2. URL Losers – this is where I estimate the loss based on Query data from GSC.
Why do the estimation if GSC gives me exact numbers in terms of lost clicks?
The problem with GSC is that it does not show you all the data. They only show a portion – big enough sample.
Since I like to know exactly what the visible keywords lost, I do the estimation and then compare it with the GSC numbers for each URL to see how much I don’t see.
Funny right? See how much I don’t see…?
It might be, but it definitely helps me wrap my head around how much more digging I need to do in other sources to discover missing keywords.
Besides, someone smart (Socrates!!) once said:
And in my approach, what I don’t know is where I focus the most.
The next steps for me were:
- Adding link information for each URL.
- Looking at the URLs and keywords and adding my opinion of what may have happened:
- Comparing Link Profile.
- Formulating a conclusion based on other websites ranking higher (or in top 10).
- Recommendation.
I do that for every single URL that has lost traffic.
Here’s what it looks like:

A few notes on this part:
- It’s almost impossible to automate this task.
You could potentially use Surfer SEO or something similar to try analyzing this at scale, but it would still be a very limited scale. I don’t know any tools that can take in 10+ keywords and run a solid human-like analysis on all of them, AND on top of that, compare them to your page. (If you know a tool like this, let me know – if it really does what I said and is reliable, I’ll pay you xD)Anyway, I looked at some small optimizations of this process. But there was always something. For example, if I were to use Ahrefs (and not Google) for the list of ranking pages, I’d be risking outdated SERPs or missing some crucial details like SERP features. Overall, couldn’t find anything that wasn’t going to impact the quality of the data or wouldn’t betray me another way. So AFAIK, this part is mundane manual labour. - I DO NOT FOCUS ON INDIVIDUAL KEYWORDS! I’ve got to say it loud and clear. I use keywords to look at the competitors, but I do not focus on individual terms. My approach leads me to look at many keywords per each URL (you can call them clusters), while the most beneficial part is gauging and vetting the competitors.
This phase gave us answers that led to the following conclusions:
- THE MOST IMPORTANT DISCOVERY
We lost significantly more traffic and keyword clusters around commercial keywords than we initially expected. We lost some core terms that were driving A LOT of traffic, but also long-tail keywords that landed on commercial pages. Not only that, but we were potentially facing a much more severe revenue impact than initially estimated (at least 50-60%). Not good! - The site lost many informative keywords because its content wasn’t qualitative enough when compared to the competitors.
- The site also lost plenty of terms that were simply outdated (e.g., referring to 2019 tax law when it was 2021 already).
Phase 2: Keyword and Content Plan
The next step we took was to look at keywords and do keyword research focused on recovering revenue.
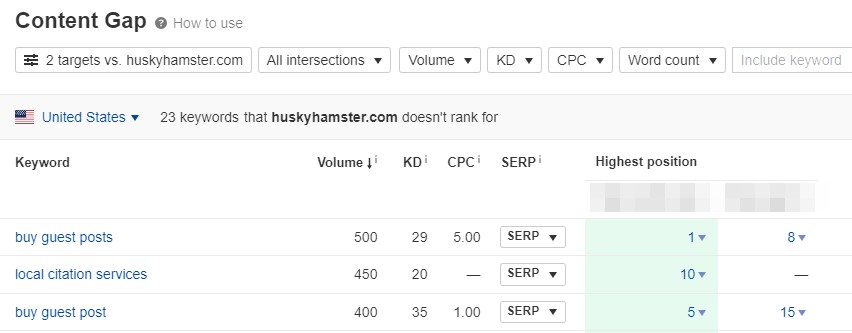
One way to do it is with Ahrefs’ Content Gap.
- Go to Ahrefs
- Type in your domain in Site Explorer
- Go to Content gap
- Fill in your competitors (IMO works best with 2-3)
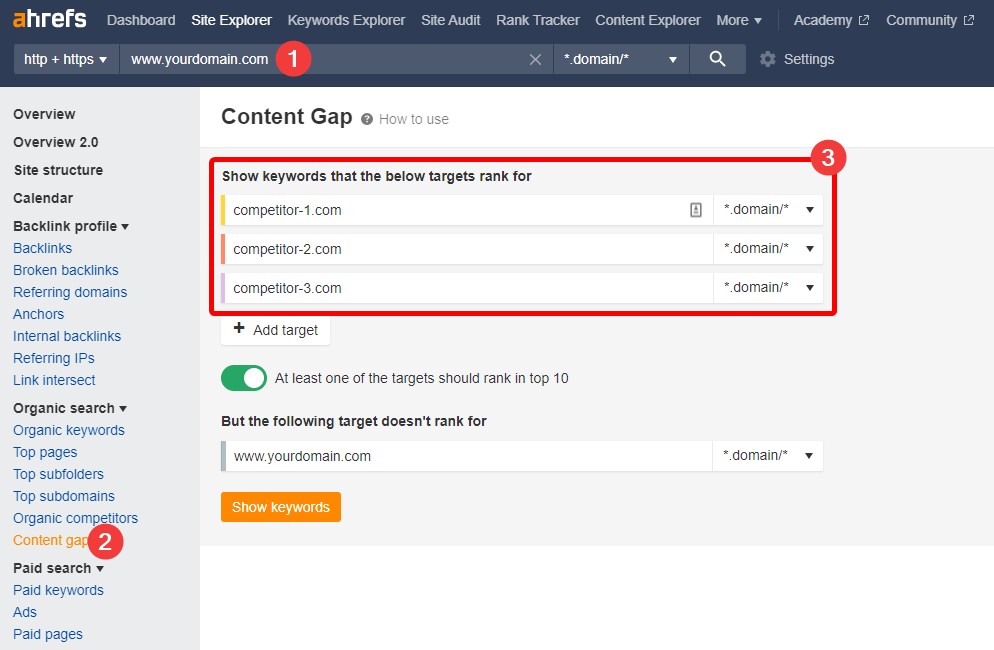
The list you receive allows you to see what terms your competitors are ranking for, but you are not:
From here, we just had to pick keywords that were:
- rankable in 4 months,
- commercial (priority 1) or informative (priority 2) in nature,
- had a potential to generate traffic.
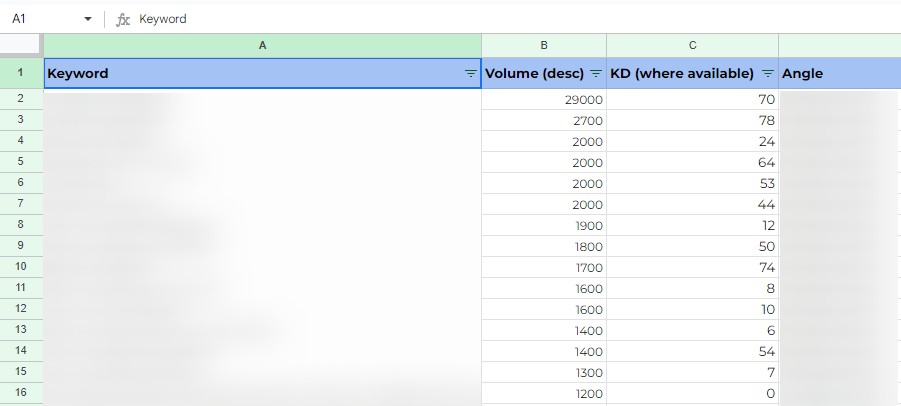
Based on this, we created a spreadsheet with the list of keywords, keyword difficulty, cluster, and search volume:
Lastly, using the list of keywords, we devised the content plan and link building strategy.
When it comes to the content plan, it’s just another spreadsheet with a lot of useful data columns:
- Cluster/Angle
Different clusters are marked in different colors for ease of identification. - Article Title
- Article Description
- Tags/keywords
- Search Intent
- Competitor Example
- Words
- Comments/Brief
Something like this:

Phase 3: Link Building
When it came to link building, the competitors were really going at it…
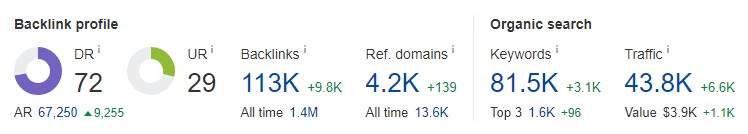
We were hundreds of domains behind them.
It’s like comparing BenQ:
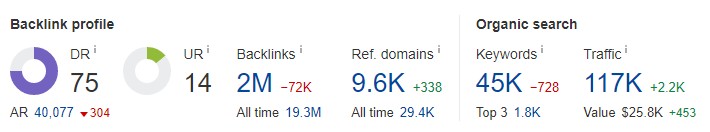
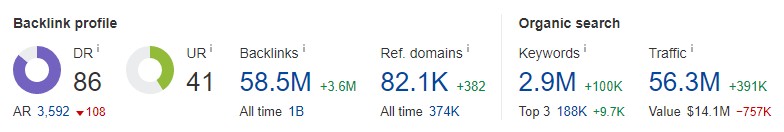
To frickin’ Amazon:
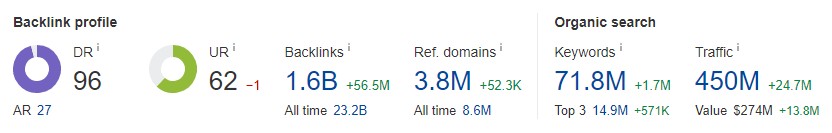
OK, maybe not that dramatic – I’m overexaggerating.
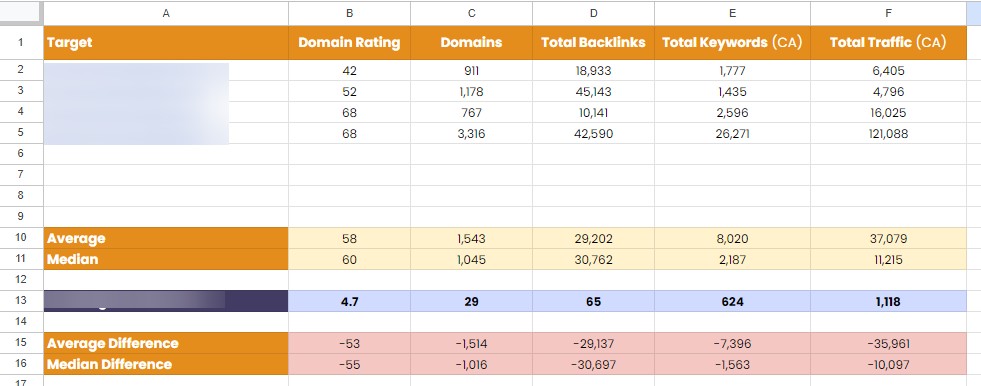
But it’s enough to say that we had just shy of 900 referring domains, and the closest competitor had over 1,500.
So, what do you do if the gap is so big?
You focus on quality.
According to our estimation, most of the competitors had around 50% of their links of poor quality (AKA junk).
What to do with this information?
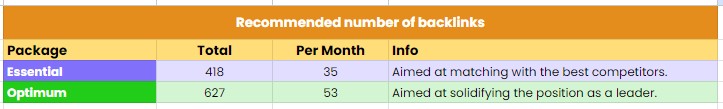
Well, we did something we always do – we created a Link Requirement Plan document, which looks something like this:
It’s outside the scope of this case study to explain how it works exactly, but you can probably figure it out on your own 😉
In any case, the LRP gives us some estimations:
You see, the formula that calculates totals, incorporates a damping factor.
I included this in the documents to take into account the superiority of links built by NoN Agency (hint, hint: self-promotion) when compared to the average that the competitors are getting.
In our case, we already knew that the damping factor was 0.5 (aforementioned 50%).
It means that if the links we build are solely of better quality than the links your competitors have, we can build 50% fewer of them.
With this in mind, we just created the proper link plan, which is simple and looks similar to this:

Because links take an average of 4-9 weeks to take full effect, we front-loaded as much budget as possible into the first 3 months of the link building campaign.
And we managed to get some really good ones:
Want Links Like This? Order Them Now!
Phase 4: Optimisations
Honestly, there were plenty of fixes we implemented.
For one, we cut out a lot of content.
For example, everything that was 2020 and earlier was reviewed and either deleted or updated to comply with the current tax ordinance.
Secondly, we noindexed A LOT of index bloat.
Overall, we did a lot of cleaning. Alas, I can’t explain this in more detail because it’s beyond the scope of this post.
One thing that is important here is that we had to effectively prioritize all optimization work because we knew we only had a very limited time.
For this reason, it didn’t make sense to fix all small bugs or focus on some small number of page titles.
These things were just not going to cut it.
We only worked with optimizations we could leverage site-wide or those that were significant oversights.
The Half-Time Results
We’ve worked tirelessly from September 2021 to March 2022.
The first improvement was good, but it wasn’t enough for us.

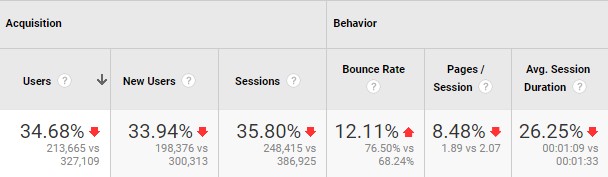
(I’m comparing it to the previous period as this is the closest we can get to a comparable window, while also excluding the seasonality.)
And we did quite OK when taking into account the high season of 2022 and the looming threat of losing 35% traffic and 50-60% revenue.

Just to emphasize it:
We were facing a 35% drop in traffic, but managed to revert it to only -12.91%.
However, at this stage, there were 2 even more important points:
1. WE SAVED THE REVENUE
The revenue (which was the most important KPI for the client) remained approximately the same as last year – at $2.5M USD.
2. The client declared to continue working with us.
The end … ?
No!
Honestly, if this was the end of this case study and I were you, I would be PISSED OFF with myself.
This is why it is not the end!
Challenge #2
So what’s the next challenge?
Well, we just keep working because it’s not the end, right?
Yes, in short.
The longer version includes some predictions and expectations from the client to bring them at least a 30% increase in traffic year over year.
So, TL;DR, the 30% YoY traffic increase was our goal for the 2023 tax season.
Boy, were they WRONG setting this target! (In a good way!)
Round 2
Remember when I told you earlier that there was more to this unusual arrangement of working on the site only between September and April?
Since we knew that the client was planning to pause the agency arrangement from May to September, we left them with a fair bit of homework to cover during the whole pause period:
- Content plan
I mean, you have got to keep pushing that content live, right? - Some site template updates
These were a bit risky to implement just before the high tax season, so we tasked the client’s developer team with changes when they were less busy. - On-site optimisations
Now came the time for some smaller and medium-sized tweaks we did not manage to implement or didn’t wanna risk earlier.
Oh, the interesting part was when we actually deleted the entire forum section of the site because it was mainly low-quality UGC (user-generated content). This was a big and relatively risky change because you never fully know how Google is going to react to a big shift like this.
It’s what caused the site to have 5x the number of 410 issues (all controlled, ok!?):
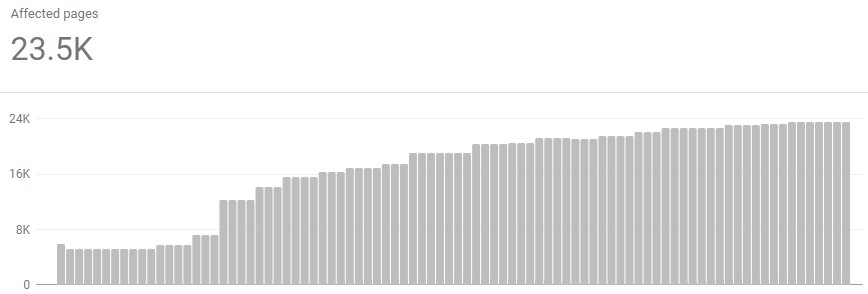
Usually, you should either redirect pages like these or block them, but we wanted to get rid of them from the index ASAP.
410 Gone header is the most effective way to permanently remove from Google’s index pages you don’t want.
When we restarted again in September 2022, we were looking quite good, especially since there were some Google updates happening along the way:

Even though forecasts were good, we, again, did similar research to what we did last year and applied the content and link building strategies built upon it.
This included (but not limited to!):
- Writing new content for 2023
- Updating outdated content
- Building new links
- “Stealing” links from competitors – it’s funny, but you can do wonders if you just approach the publisher with an updated content about tax stuff.
- Some more index cleaning and individual on-page optimisations.
This time around, we didn’t have to work in panic mode and had time for this.
The Actual Results
It might be bragging, but what the heck!
This year, we totally outdid ourselves!
Just look at this:

Keep in mind that April isn’t finished yet, so we’re looking at the comparable YoY periods.
I’ll try to update these numbers at the end of the month, but clearly, we’re waaaay better than we were last year.
Here’s a look at Google Search Console data:
Numbers
- 689,135 more organic visitors / 124.45% growth
Organic visitors growth from 553,759 to 1,242,894 year over year. - 850,286 more sessions / 119.39% increase
Organic sessions up from 712,205 to 1,562,491 year over year. - 2.33x more clicks
Growth from 583k to 1.36M clicks in Google Search Console. - 28.6M Overall Impressions Received (128% / 2.29x growth)
From 12.5M to 28.6M YoY.
Revenue details are still pending, but they’re already looking excellent.
Continuing to brag, I’ll just say that it’s much easier to get 124% or 2.33x increase when we’re talking just hundreds or thousands of users or sessions/clicks.
But in this case, we’re talking about hundreds of thousands of both, so the results are even more impressive than they may sound.
Case study created by:
Co-Founder & CTO
Even though this project seemed impossible at first, we managed to develop the plan of attack, execute it and save the day.
And after saving the day, we did exactly what a Marvel superhero would do – we got back to work to achieve even better results.
Psst! You can contact us here, to talk about your project!
I hope you learned a few things from this case study.
As for me, outside of perseverance and keeping your head cool, solid analysis, strategy and prioritizing were what allowed us to help this website reach its all-time highs.